
Engineering Market Dominance: How We Reversed a Critical Decline to Hit 20.8 Million Impressions
JOIN THOUSANDS
of subscribers who get fresh content to help their business weekly.
of subscribers who get fresh content to help their business weekly.
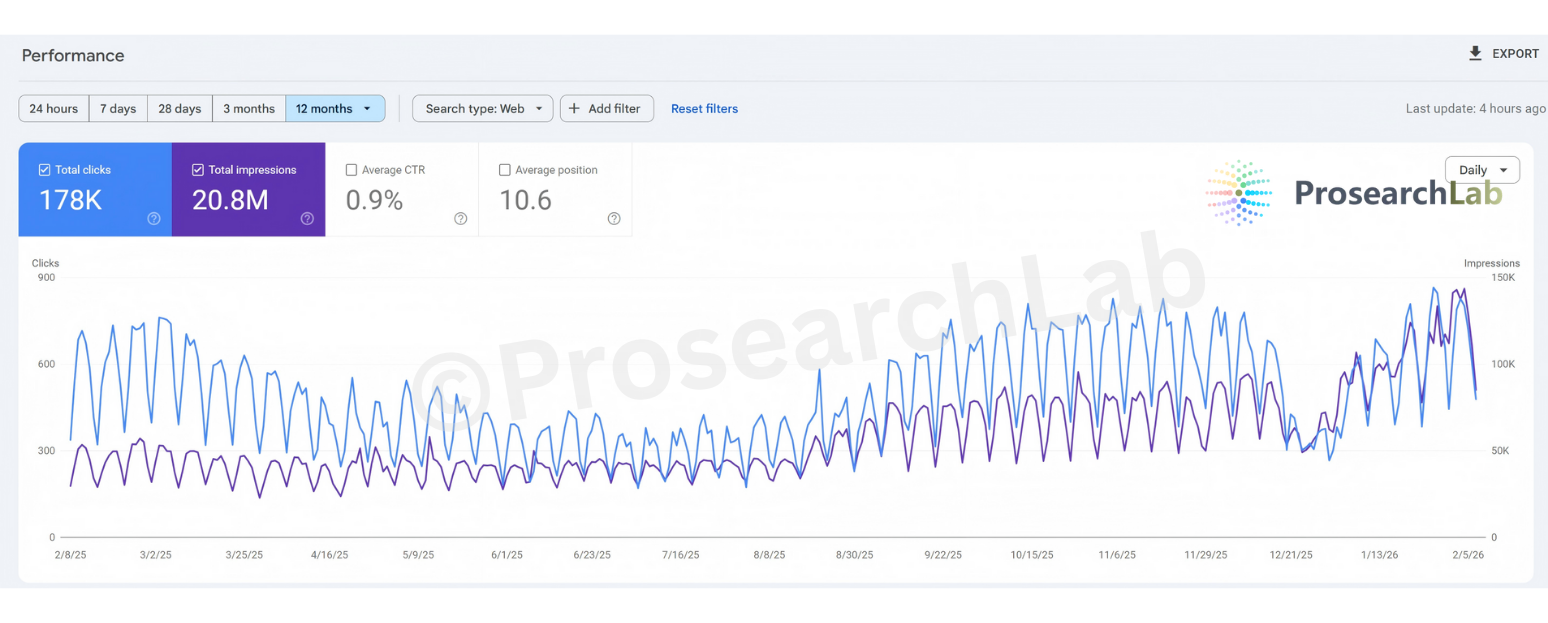
Figure 1: Organic traffic recovery hitting a record 20.8 million impressions.
Client Sector: Enterprise FinTech & Market Intelligence
Project Timeline: May 2025 – January 2026
Key Achievement: Reversing a multi-quarter downward trend to hit 20.8 Million Impressions
When the client first established contact with ProsearchLab in May 2025, the internal atmosphere was one of palpable urgency. As a major player in the global financial market intelligence space, their business model relies heavily on organic search visibility to drive lead acquisition. However, as the initial section of the performance chart illustrates, their digital presence was hemorrhaging value.
Despite a robust content team churning out dozens of market reports daily, their organic traffic was on a relentless downward trajectory. They were losing ground on high-value commercial keywords that had historically been their stronghold. The client’s internal team had attempted various quick fixes—increasing post frequency, adjusting meta tags—but nothing was arresting the decline. They were facing a classic ranking decay scenario, where legacy technical debt and outdated architectural decisions were finally catching up with them, causing search engines to devalue their entire domain. They needed a partner who could look beyond surface-level metrics and engineer a complete structural turnaround.
Upon assuming full control of the SEO strategy in late May, ProsearchLab made a controversial but necessary decision: we chose to stop chasing short-term metrics and instead initiated a comprehensive Summer Surgery.
We recognized that the approaching summer months (June through August) typically bring a natural lull in B2B financial search traffic as decision-makers and traders take time off. Rather than fighting this seasonal tide with aggressive but futile content pushes, we used this period of lower activity to perform the heavy technical lifting that would have been too risky during peak season.
What appears as a relatively flat, low-activity period in the center of the graph is actually the story of a successful stabilization. During these three months, our engineering and SEO teams worked in tandem to resolve deep-seated infrastructure issues. We overhauled the site’s crawl budget management, pruning thousands of "zombie pages" that were diluting domain authority. We fixed critical canonicalization errors that were causing self-competition among their news articles, and we implemented a modern schema framework to help Google parse their real-time data faster. While the traffic didn't skyrocket immediately, we achieved the primary goal: we stopped the bleeding. By August, the downward spiral had halted, and the foundation was set.
The validation of our foundational work began to materialize in September. With the technical impediments removed, the site became responsive to our content strategies for the first time in over a year. As the chart demonstrates, the period from September through November shows a healthy, consistent climb. The sawtooth pattern became more defined and robust—a healthy sign of high weekday engagement from corporate users—and the overall baseline traffic trended upward week over week.
Then came late December. To the untrained eye, the sharp drop visible on the graph might look like a penalty or a failure. However, in the context of Enterprise B2B SEO, this is a predictable market behavior. This drop corresponds precisely with the Western holiday season (Christmas and New Year), where global financial markets slow down, and corporate search volume naturally evaporates. We had prepared the client for this dip, assuring them that it was purely environmental, not technical. We used this quiet week not to panic, but to finalize our deployment for the upcoming fiscal year.
The true test of our strategy—and the climax of this case study—occurred in the first weeks of January 2026. Because we had spent the previous six months fixing the engine rather than just painting the car, the site was primed for maximum performance when the market returned to work.
The recovery wasn't just gradual; it was explosive. As professionals returned to their desks and financial markets rallied for the new year, the client’s site captured an unprecedented share of that search demand. The far right of the chart shows a vertical takeoff, driving daily impressions to over 150,000—a figure that shattered all previous records set in early 2025.
This wasn't luck. It was the result of the forward-looking keyword strategy we implemented back in November, positioning the client to rank #1 for "2026 Market Outlook" and strategic planning queries before the year even started. By the time competitors were reacting to the new year's trends, our client was already dominating the conversation. This project stands as a testament to the ProsearchLab philosophy: we don't just fix traffic; we build resilient, high-performance engines that turn market volatility into long-term dominance.
Handpicked insights from the ProsearchLab editorial team


